June 2022 - Week 4 Edition
The Fed Created Runaway Inflation in 2020 and 2021 – Now it is Sopping Up That Money, Depressing Stocks and Bitcoin (But Not Gold)
Metals have held up remarkably well considering the U.S. Dollar is now at a 20-year high against a basket of other major currencies. The dollar is up simply because the Federal Reserve (Fed) is raising interest rates while Europe and Japan are keeping their rates near zero, so investors are pouring cash into 3% dollar returns.
When the Fed flooded America with over $6 trillion in printing press money in 2020 and early 2021, some of that money did not go toward needy families. It went to middle-class employed people and some used it to bid up prices of stocks, housing, bitcoin and some commodities, including gold in 2021. Now, when the Fed has stopped printing new money, has raised rates and will soon “sop up” that money through “quantitative tightening,” they are depressing the stock market, bitcoin, bonds and many other investments, but not gold, which has stayed firm above $1,800 per ounce, despite a super-strong dollar.
Bitcoin peaked at $68,925 last November. On Thursday of last week, it had lost 74.5% to $17,600. Last November, the tech-heavy NASDAQ index peaked at 16,212. Last week, it hit a low of 10,565, down 35%. What happened last November? At the Federal Open Market Committee (FOMC) meeting on November 3, 2021, Federal Reserve Chair Jerome Powell indicated the FOMC “will start to reduce the pace of asset purchases,” in a process called “tapering.” Previously, the Fed had been purchasing $80 billion in U.S. Treasury securities and $40 billion in U.S. agency securities each month, thereby adding $1.44 trillion in money supply each year. In November, they warned that this gravy train would disappear in 2022 and they would start reducing their balance sheet (available money supply) by $95 billion a month.
That’s when investors had to decide where they wanted to store their money for the long-term. That’s when tech stocks and bitcoin began to fall. Then blue-chip stocks began to fall in January. Real estate prices held up pretty well, and so did gold, but many other investments fell big-time.
This is where “volatility” comes into play. It does investors no good to claim great profits if they are only on paper and they disappear overnight. Sometimes return of principal is more important than return on principal. There are also liquidity problems. There have been some sad stories of cryptocurrency owners who are not able to withdraw their funds from risky internet dealers. That merely adds to urgency of getting out “at any price” in a classic selling panic.
With this volatility and liquidity in mind, let’s compare where asset prices were seven months ago to today.

Gold has been very “boring” since last November, and sometimes boring is good. From a November 2021 peak of nearly $1,865, gold reached a June low of $1,818, but its AVERAGE price last November was $1,820.23, and its average so far this June is $1,837.25, up about 1%, which is boring, except that gold is both solid and liquid – like “Old Man River” – avoiding any 25% to 75% losses along the way.
One seven-month nightmare is not a fair comparison. Over the long-term, investors should hold a large share of their portfolio in carefully selected blue-chip stocks, but gold has a very important role as a portfolio anchor and insurance safeguard, which most investors sadly ignore, looking for “spectacular” returns.
In normal markets, gold is a replacement for paper currencies and bonds, but in bad times it is also an insurance policy for stock market crashes. Over the long-term, precious metals often out-perform stocks. Since the year 2000, the metals are still leading stocks, with silver doubling most major stock indexes and gold more than tripling the major market indexes:

Gold Demand Soars in the First Quarter – Mostly Due to Rising Gold ETF Demand
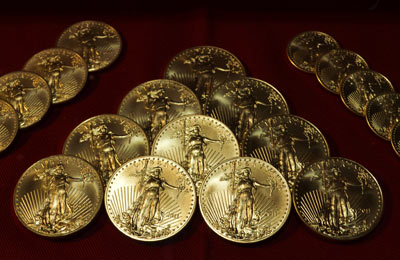
Worldwide gold demand for the first quarter of calendar year 2022 was 34% higher than for the same period in 2021, according to Gold Demand Trends released by The World Gold Council. Total market demand reached 1,234 metric tons – the highest quarterly total since the fourth quarter of 2018, and 19% above the five-year average of 1,039 metric tons. This impressive increase is mostly due to investments in exchange-traded funds (ETFs), which rose to 268.8 metric tons last quarter, 58% above the 170 metric tons bought in the same quarter in 2021. Also, the U.S. Mint’s first quarter 2022 gold sales of 518,000 ounces of American Eagle and American Buffalo gold coins was the highest first quarter sales since 1999.
Due in part to a return of COVID-19 in China, their gold demand fell 43% in first quarter of 2022 vs. the same quarter in 2021. Gold bar and coin investment in India climbed 5% year on year, to 41 metric tons, while gold bar and coin investment in the Middle East and Turkey fell 77% in the first quarter. The price of gold averaged $1,877 last quarter, which is 5% above the $1,787 average in the first quarter of 2021.
The Silver Institute projected record demand for silver this year. Investment demand is projected to rise 13% to a seven-year high, while jewelry demand is expected to rise 11% and silverware +21%. Total demand is expected to reach 1.112 billion ounces (+8%) while new silver supplies are projected to reach 1.092 billion ounces (+7%), for a shortfall of 20 million ounces, the second straight year of supply shortfall.
Fundamentals should help propel the price of gold, silver and rare coins into higher gains by year’s end, while stocks, bitcoin and other investments remain volatile.

Important Disclosure Notification: All statements, opinions, pricing, and ideas herein are believed to be reliable, truthful and accurate to the best of the Publisher's knowledge at this time. They are not guaranteed in any way by anybody and are subject to change over time. The Publisher disclaims and is not liable for any claims or losses which may be incurred by third parties while relying on information published herein. Individuals should not look at this publication as giving finance or investment advice or information for their individual suitability. All readers are advised to independently verify all representations made herein or by its representatives for your individual suitability before making your investment or collecting decisions. Arbitration: This company strives to handle customer complaint issues directly with customer in an expeditious manner. In the event an amicable resolution cannot be reached, you agree to accept binding arbitration. Any dispute, controversy, claim or disagreement arising out of or relating to transactions between you and this company shall be resolved by binding arbitration pursuant to the Federal Arbitration Act and conducted in Beaumont, Jefferson County, Texas. It is understood that the parties waive any right to a jury trial. Judgment upon the award rendered by the Arbitrator may be entered in any court having jurisdiction thereof. Reproduction or quotation of this newsletter is prohibited without written permission of the Publisher.


